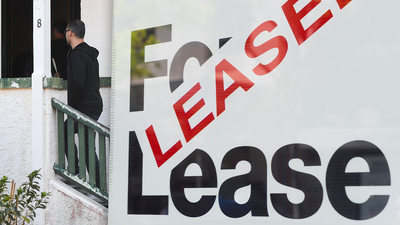

New data has put another line under how much renters are struggling around the country, with those doing it toughest putting more than 40 per cent of their income towards the rent.
Suburbtrends' September "Rental Pain Index" also found that many renters around the country had faced rent rises of over 10 per cent in the past 12 months.
The index scores suburbs from one (great!) to 100 (move out) based on factors including average rent rises, average amount of income towards rent, and rental vacancies in an area.
Here, counting down, are Australia's 25 most painful suburbs to be renting in.
25. Keperra, Queensland
Average 12-month rental increase: Eight per cent
Rental affordability as a percentage of income: 31 per cent
Vacancy rate: 0.63 per cent
Rental pain index: 96
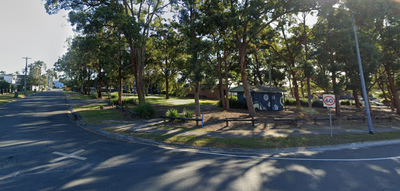
24. Warilla, NSW
Average 12-month rental increase: Five per cent
Rental affordability as a percentage of income: 43 per cent
Vacancy rate: 0.19 per cent
Rental pain index: 96
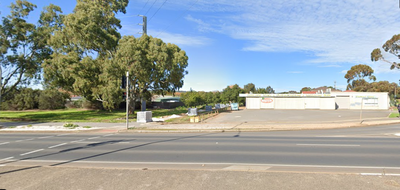
23. Morphett Vale - East, SA
Average 12-month rental increase: 13 per cent
Rental affordability as a percentage of income: 35 per cent
Vacancy rate: 0.94 per cent
Rental pain index: 96
22. Mayfield - Warabrook
Average 12-month rental increase: Seven per cent
Rental affordability as a percentage of income: 33 per cent
Vacancy rate: 0.17 per cent
Rental pain index: 96
21. Wheelers Hill, Victoria
Average 12-month rental increase: 15 per cent
Rental affordability as a percentage of income: 31 per cent
Vacancy rate: 0.61
Rental pain index: 96
20. Bidwill - Hebersham - Emerton, NSW
Average 12-month rental increase: 10 per cent
Rental affordability as a percentage of income: 32 per cent
Vacancy rate: 0.53 per cent
Rental pain index: 97
19. Bankstown - North, NSW
Average 12-month rental increase: 17 per cent
Rental affordability as a percentage of income: 35 per cent
Vacancy rate: 0.8 per cent
Rental pain index: 97
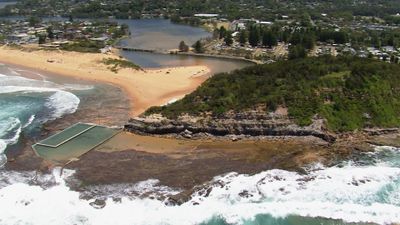
18. North Narrabeen - Warriewood (South), NSW
Average 12-month rental increase: Nine per cent
Rental affordability as a percentage of income: 32 per cent
Vacancy rate: 0.4 per cent
Rental pain index: 97
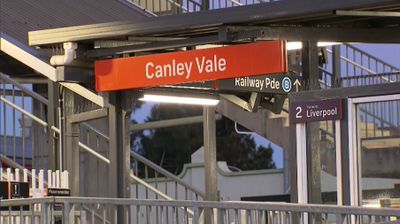
17. Canley Vale - Canley Heights, NSW
Average 12-month rental increase: 17 per cent
Rental affordability as a percentage of income: 32 per cent
Vacancy rate: 0.89 per cent
Rental pain index: 97
16. Smithfield - Elizabeth North, SA
Average 12-month rental increase: 15 per cent
Rental affordability as a percentage of income: 37 per cent
Vacancy rate: 0.52 per cent
Rental pain index: 98
15. Thorneside, Queensland
Average 12-month rental increase: 11 per cent
Rental affordability as a percentage of income: 36 per cent
Vacancy rate: 0.46 per cent
Rental pain index: 98
14. Woodridge, Queensland
Average 12-month rental increase: 16 per cent
Rental affordability as a percentage of income: 38 per cent
Vacancy rate: 0.34 per cent
Rental pain index: 99
13. Calista, WA
Average 12-month rental increase: 17 per cent
Rental affordability as a percentage of income: 34 per cent
Vacancy rate: 0.42 per cent
Rental pain index: 99
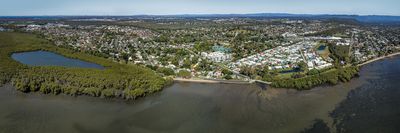
12. Deception Bay, Qld
Average 12-month rental increase: 13 per cent
Rental affordability as a percentage of income: 35 per cent
Vacancy rate: 0.69
Rental pain index: 99
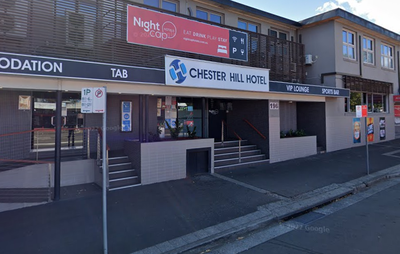
11. Chester Hill - Sefton, NSW
Average 12-month rental increase: 13 per cent
Rental affordability as a percentage of income: 38 per cent
Vacancy rate: 0.85 per cent
Rental pain index: 99
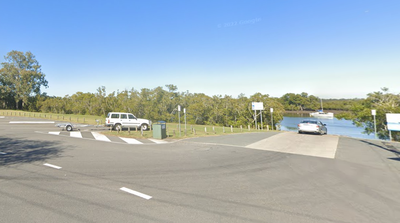
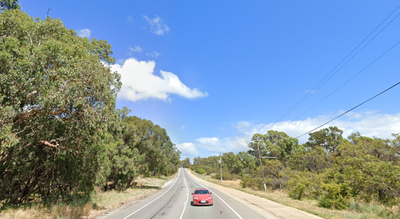
10. Kincumber - Picketts Valley, NSW
Average 12-month rental increase: Six per cent
Rental affordability as a percentage of income: 44 per cent
Vacancy rate: 0.57 per cent
Rental pain index: 99 per cent
9. Bass Hill - Georges Hall, NSW
Average 12-month rental increase: 17 per cent
Rental affordability as a percentage of income: 45 per cent
Vacancy rate: 1.08 per cent
Rental pain index: 99
8. St Johns Park - Wakeley, NSW
Average 12-month rental increase: 15 per cent
Rental affordability as a percentage of income: 35 per cent
Vacancy rate: 0.87 per cent
Rental pain index: 100
7. Seaton - Grange, SA
Average 12-month rental increase: 13 per cent
Rental affordability as a percentage of income: 35 per cent
Vacancy rate: 0.93 per cent
Rental pain index: 100
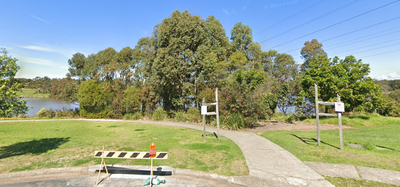
6. Invermay, Tasmania
Average 12-month rental increase: Nine per cent
Rental affordability as a percentage of income: 35 per cent
Vacancy rate: 0.87 per cent
Rental pain index: 100